

















Health tech, Engineering case study

Health Optimisation
Platform.

Blood panels, DNA, DEXA scans and wearable data all say something different about a person's health. This app reconciles them into one score, then uses AI to explain what actually matters.

Role
Full-stack build + AI features
Client
AU health-tech company
Platform
Web app (live)
Tools
React, Node/Express, MongoDB, Firebase

Scroll to watch it work. Or hold.

01 / Raw02 / Parsed03 / Registered04 / Shipped
plate offset 14.0px
fromscore 82, as shipped

Four sources, zero shared language.

Lab PDFs, DEXA layouts, DNA variants and wearable streams, each in its own units. Hold the button to line them up, or keep scrolling.

Lab PDFs into structured, comparable data.

A scan line reads every source into markers, units and flags. DEXA reports are cropped by reading the PDF itself, not a scanner template.

Reconciling four sources into one number.

Six domains, unit conversions, one longevity score and a biological age. Partial data still scores, and says how much is missing.

Live, in production.

The scoring engine, the DEXA pipeline and the AI insights layer run against real client data.

Feature 02Body scan
01 / Vendor PDFs02 / Locate03 / Extract04 / Score
layouts 0/12

Twelve scanners, twelve layouts.

Each vendor prints the body-composition chart in a different place, size and unit.

Read the PDF, not a template.

The crop finds the chart from the PDF drawing operators, so a new vendor still works.

The chart becomes numbers.

Arms, legs, trunk and visceral fat come out as values, not a picture.

Ranked against people your age.

Each region lands on an age-matched percentile instead of a fixed cutoff.

Feature 03Genetics
01 / Variants02 / Pathways03 / Cross-check04 / One insight
0 variants

Raw DNA is a list of letters.

Hundreds of variants arrive as bare rsIDs with no context.

Sorted by what they do.

Lipid, methylation, glucose and lactose: variants fall into pathways.

Then checked against your blood.

APOE e4 and a high LDL-C point at the same mechanism, so they surface together.

Compounding risk, in plain English.

Two flags become one finding, with the markers behind it one tap away.

Feature 04Wearables
01 / Connect02 / Stream03 / Notice04 / Feed
linking devices

Rings, watches and phones, one stream.

Devices connect once, then push HRV, sleep and heart rate every night.

Thirty nights in one glance.

Sleep stages, resting heart rate and HRV line up on a single timeline.

The dip nobody felt.

HRV slides for three nights while sleep debt builds, and the app flags it first.

Into the score.

Recovery and readiness feed the vitals domain of the longevity score.

Feature 05AI chat
01 / Ask02 / Ground03 / Follow up04 / Act
sources 0/4

Ask about your own numbers.

The chat sees your biomarkers, not just your question.

Every claim cites a marker.

Statements link back to the lab values that justify them.

Keep pulling the thread.

Suggested follow-ups stay focused on the marker in question.

From answer to action.

One tap turns the advice into a plan.

Feature 06Plan generator
01 / Goal02 / Meals03 / Training04 / Supplements
goal: fat loss

One goal, three plans.

Pick a target and the app builds meals, training and supplements around your data.

A week of meals that fit.

Each meal is scored against macro targets and tagged with the marker it helps.

Training that adapts.

Swap an exercise and the progression rebalances around it.

Only what the labs justify.

Each supplement points to the marker that asks for it.

Feature 07On the phone
01 / Desktop02 / Reflow03 / Phone

Built wide first.

Six cards across a three-column dashboard.

Restacked, not shrunk.

Cards reorder by priority and tables become card grids.

The score stays on top.

Score, domains and insights, all within thumb reach.

dashboard
Today's priorities: Raise dietary nitrate 1 DAY STREAK
DashboardInsightsPlanProgressEnterprise
Readiness
Connect a device
Resting HR
Connect a device
HRV
Connect a device
Sleep score
Connect a device
Steps
Connect a device
Active kcal
Connect a device
Today's planBiomarkersGeneticsBodyscanVitals
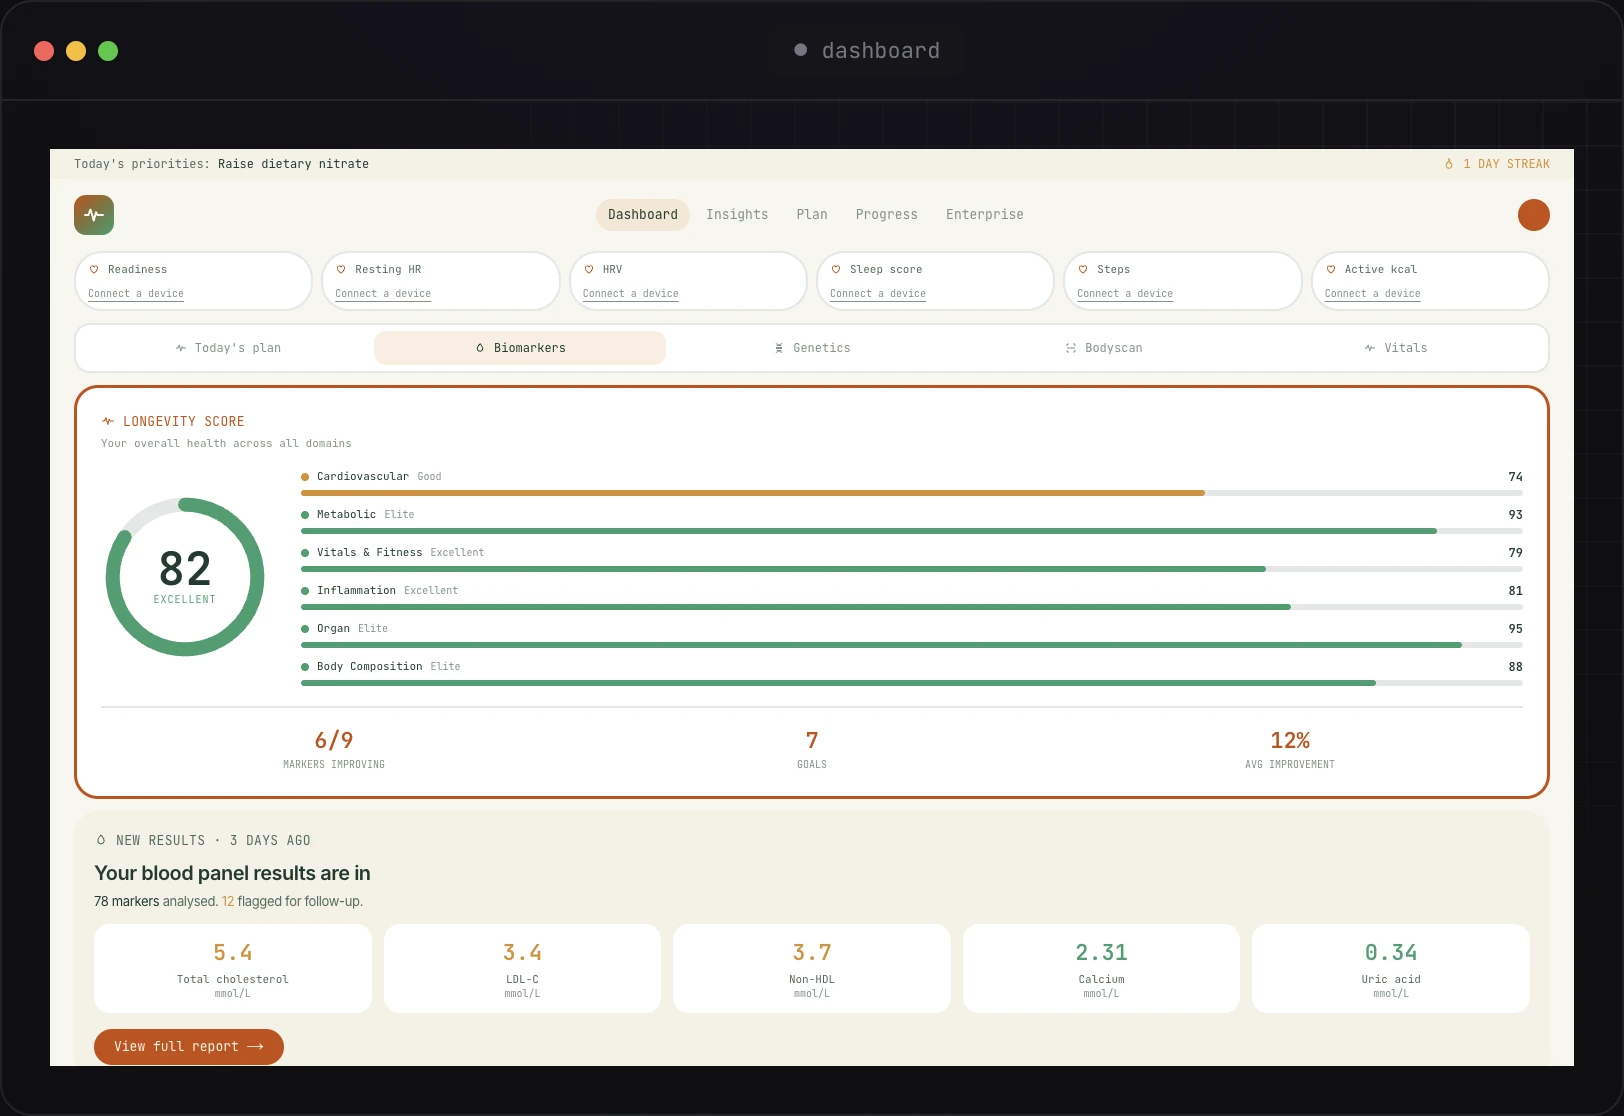
LONGEVITY SCORE
Your overall health across all domains
82EXCELLENT
CardiovascularGood74
MetabolicElite93
Vitals & FitnessExcellent79
InflammationExcellent81
OrganElite95
Body CompositionElite88
6/9
MARKERS IMPROVING
7
GOALS
12%
AVG IMPROVEMENT
NEW RESULTS · 3 DAYS AGO
Your blood panel results are in
78 markers analysed. 12 flagged for follow-up.
5.4
Total cholesterol
mmol/L
3.4
LDL-C
mmol/L
3.7
Non-HDL
mmol/L
2.31
Calcium
mmol/L
0.34
Uric acid
mmol/L
View full report →
RECENT TRENDS · 7 DAYS
MetricThis weekLast weekChange
HRV58ms54ms+4
Resting HR51bpm53bpm-2
Sleep score8479+5
Steps9,240/day8,610/day+630
The landing view: connected wearables along the top, then the newest blood panel with the flagged markers pulled forward instead of buried in a PDF.
longevity score
Today's priorities: Raise dietary nitrate 1 DAY STREAK
DashboardInsightsPlanProgressEnterprise
LONGEVITY SCORE
Your overall health across all domains
82EXCELLENT
CardiovascularGood74
MetabolicElite93
Vitals & FitnessExcellent79
InflammationExcellent81
OrganElite95
Body CompositionElite88
● Priority: Cardiovascular optimisation
See all insights
TODAY'S PLAN
Zone 2 cardio, 40 minutes
Add dietary nitrate at lunch
Strength session, lower body
Magnesium before bed
RECENT UPLOADS
Blood panel3 days ago
DEXA scan6 weeks ago
DNA report4 months ago
BIO AGEHigh confidence · 6/6 domains
34yearsYou are 5 years younger biologically
BLOOD AGE
33
42%
VITALS AGE
35
26%
BODY AGE
33
22%
ACTIVITY AGE
36
10%
BIO AGE OVER TIME (5 blood tests)
39Dec
38Feb
36Apr
35Jun
34Aug
AGEING SPEED
0.91x
You are ageing 0.91 biological years per calendar year.
↓ Slowed by 9% vs baseline
Trend: upload more blood tests to track
WHAT'S IMPACTING YOUR AGEING SPEED▾
PRIORITY ACTIONS
Lower LDL-C
Cardiovascular
Hold metabolic gains
Metabolic
Raise hydration
Organ
Six domains scored separately, then rolled into one number, sitting next to the biological-age model and today's plan.
insight feed
Today's priorities: Raise dietary nitrate 1 DAY STREAK
DashboardInsightsPlanProgressEnterprise
Your health insights12insights
12
Total insights
6
Act now
82
Longevity score
AllStrengthsAct nowOptimiseOn trackFitnessNutritionSleepMindBody
Biomarker / blood insights
Keep Zone 2 cardio at 150 minutes weekly
On track
Lipids, metabolic health, cardiovascular resilience
Low priorityFitnessOngoing
Learn more Remind me Ask AI
Maintain the dietary quality showing in your lipid panel
On track
ApoB, LDL-C, triglycerides
Low priorityNutritionOngoing
Learn more Remind me Ask AI
Raise daily hydration and electrolyte intake
Act now
Uric acid, kidney markers, recovery
MediumBody6 weeks
Learn more Remind me Ask AI
Add a second strength session each week
Optimise
Lean mass, insulin sensitivity, bone density
MediumFitness12 weeks
Learn more Remind me Ask AI
AI-written actions, each tagged by priority and domain, and traceable back to the markers that triggered them.
body scan
Today's priorities: Raise dietary nitrate 1 DAY STREAK
DashboardInsightsPlanProgressEnterprise
Today's planBiomarkersGeneticsBodyscanVitals
BODYSCAN · DEXA
Auto-cropped from the uploaded report
ArmsTrunkAndroidLegsRegion map74th percentile
COMPOSITION · VS AGE-MATCHED PERCENTILE
Total body fat18.4%p62
Lean mass index19.8p74
Visceral fat0.41 kgp88
Android / gynoid0.92p41
Bone density1.24 g/cm2p79
REPORT INTAKE
Upload PDF→Parse regions→Auto-crop→Score vs cohort
REGION BREAKDOWN
RegionFat %Lean kgChange
Arms14.26.8+0.3
Legs17.919.4+0.6
Trunk20.126.2-0.4
Android22.45.1-0.2
An uploaded DEXA report parsed into regions, auto-cropped, and scored against an age-matched cohort.
genetics
Today's priorities: Raise dietary nitrate 1 DAY STREAK
DashboardInsightsPlanProgressEnterprise
Today's planBiomarkersGeneticsBodyscanVitals
3 higher-risk variants to review · 41 reported
Lipid transport variantHigher risk92% conf.
Methylation efficiency variantHigher risk86% conf.
Caffeine clearance variantTypical81% conf.
Vitamin D receptor variantHigher risk77% conf.
Iron absorption variantTypical74% conf.
Folate metabolism variantTypical71% conf.
Omega-3 conversion variantWatch68% conf.
Salt sensitivity variantTypical64% conf.
CROSS-DOMAIN CHECK
The lipid transport variant sits on the same pathway as the raised LDL-C in this month's panel. Both are flagged together rather than as two unrelated findings.
DNALipid transport
BloodLDL-C 3.4
ScanAndroid / gynoid 0.92
Ask AI about this pairing
PATHWAY GROUPS
Lipid handling9 variants62
Methylation6 variants48
Detoxification11 variants81
Micronutrient uptake8 variants73
Sleep and circadian7 variants88
Reported variants grouped by pathway and cross-checked against the blood panel, so related findings surface together rather than as two unrelated flags.

An illustrated recreation of the product, not real screenshots. This is an NDA client engagement: the screens follow the real layout so the work is legible, while every name, number and record shown here is invented.

Read the full write-up
01Problem

Four data sources, zero shared language.

A blood panel reports dozens of markers in clinical units. A DNA test flags genetic risk variants. A DEXA scan returns body-composition percentages from whatever vendor scanned it. A wearable streams HRV and sleep every night. None of these speak to each other, and none of them alone tells a person whether they're actually getting healthier.

The hard part

DEXA reports in particular come from a dozen different scanner vendors, each with its own PDF layout, its own units, and its own way of cropping the body-composition chart. There was no clean API to normalise against: just PDFs.

02Goal

One score. Explainable, not a black box.

The brief was a single "longevity score" that reconciles all four sources with correct unit conversions and per-report transparency, plus AI reasoning that connects findings across domains instead of listing them as separate cards.

03Ingestion

Turning lab PDFs into structured, comparable data.

Blood panels get parsed into discrete markers and flagged against optimal ranges. DNA results resolve into named risk variants. DEXA reports are auto-cropped from the source PDF by inspecting its operator list rather than hardcoding scanner templates, then scored against reference percentiles instead of a fixed cutoff.

Scale of the ingestion: 70+ blood markers parsed per panel, All 6 domains feeding the bio-age model, 3 ingestion sources: labs, DNA, DEXA.

04The scoring engine

Reconciling four sources into one number.

The longevity score sits on top of a domain model: cardiovascular, metabolic, vitals & fitness, inflammation, organ, body composition. Each domain pulls from whichever sources have data for it, converts units where needed, and rolls up into both an overall score and a biological age estimate versus chronological age.

Confidence, not certainty

The bio-age panel only claims "high confidence" once all domains have data. Partial data still produces a score, but the UI is explicit about how much of the picture is missing, instead of presenting an incomplete estimate as gospel.

05AI reasoning

Cross-domain insight, not a wall of numbers.

The distinguishing feature isn't the score, it's what connects to what. The AI layer looks across domains at once and surfaces compounding risk (two elevated markers that share a mechanism), not just per-marker flags, then generates a personalised meal, training and supplement plan from the same underlying data.

06On the phone

The same reasoning, in your pocket.

The score, the domain breakdown, and the AI insight feed are all available on mobile, reflowed rather than shrunk down.

Dashboard 1 DAY
LONGEVITY SCORE
82EXCELLENT
Cardiovascular74
Metabolic93
Vitals & Fitness79
Inflammation81
34
BIO AGE
0.91x
AGEING SPEED
HomeInsightsPlanProgress
Score and domains, stacked.
Insights 1 DAY
AllAct nowOn track
Keep Zone 2 cardio at 150 min weekly
On track
Maintain dietary quality in your lipid panel
On track
Raise hydration and electrolyte intake
Act now
Add a second strength session
Optimise
Hold your current fibre intake
Strength
Recheck vitamin D in 12 weeks
Act now
HomeInsightsPlanProgress
The same insight feed, filtered by status.
Biomarkers 1 DAY
NEW RESULTS
Your blood panel results are in
78 markers analysed. 12 flagged.
5.4
Total cholesterol
mmol/L
3.4
LDL-C
mmol/L
3.7
Non-HDL
mmol/L
2.31
Calcium
mmol/L
View full report
HomeInsightsPlanProgress
Blood results as a two-column card grid.
07Process

Fix, deploy, verify, then report.

Shipped under a "Test & Execute" loop: every fix deploys to the live environment and gets self-verified end-to-end via Playwright with a screenshot confirmation, before it's reported as done. No "should be fixed now" without proof.

08Outcome

Live, in production.

The scoring engine, the DEXA ingestion pipeline, and the AI insights layer are all live and running against real client data.

Next case study
K-12 Education SaaS